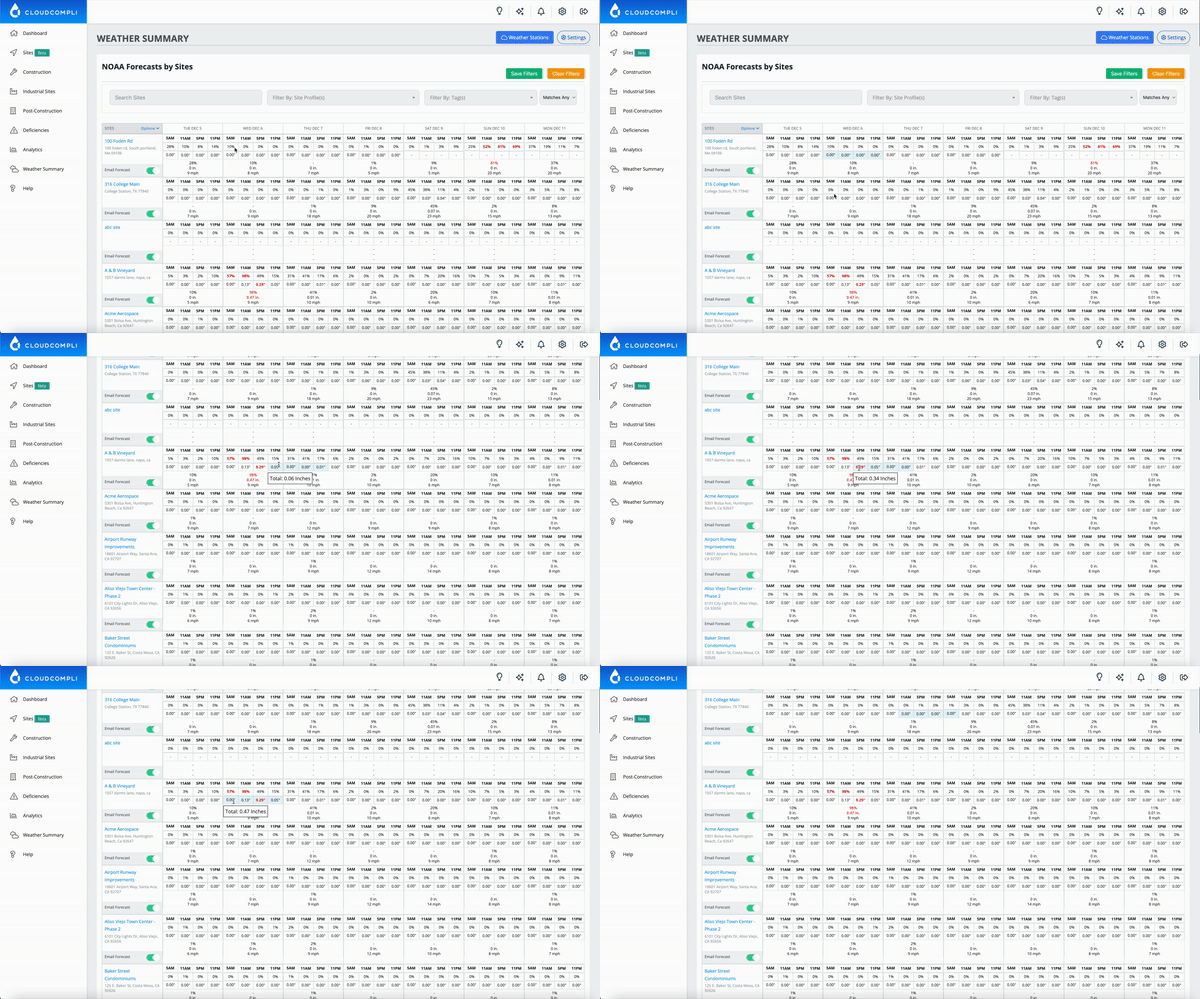
Highlight Rainfall Totals:
Users can now highlight over a 24-hour period to view the total sum of rainfall, enhancing the ability to track and predict Quantitative Precipitation Forecasts (QPFs).Details
- Interactive Summation:Hovering over the timeline for a specific day aggregates the rainfall data, providing a total in inches.
- Easy Comparison:Quickly compare rainfall across different locations and time periods for efficient stormwater management planning.
- Visual Indicators:Blue highlights indicate data selection, with a clear display of total rainfall at the bottom of the highlighted area.
Benefits
- Improved Accuracy:Enables more precise stormwater tracking by summing up the rainfall over any given 24-hour period.
- Enhanced Planning:Assists in forecasting and managing stormwater.
- User-Friendly:Intuitive design allows for easy use without requiring in-depth training.
How to Use
- Navigate to the desired date on the weather summary page.
- Click and hover over a 24-hour period.
- View the total rainfall sum that appears at the bottom of the selection.
- Use the data for planning and reporting purposes.

